A well-designed driver scorecard gives fleet operators a consistent way to understand performance across individuals, vehicles, and routes. It creates a shared reference point for discussions about safety, efficiency, and compliance.
When used correctly, driver scorecards are not about constant monitoring or blame. They are a practical tool for turning everyday driving data into fair feedback, clearer expectations, and safer behaviour across your fleet.
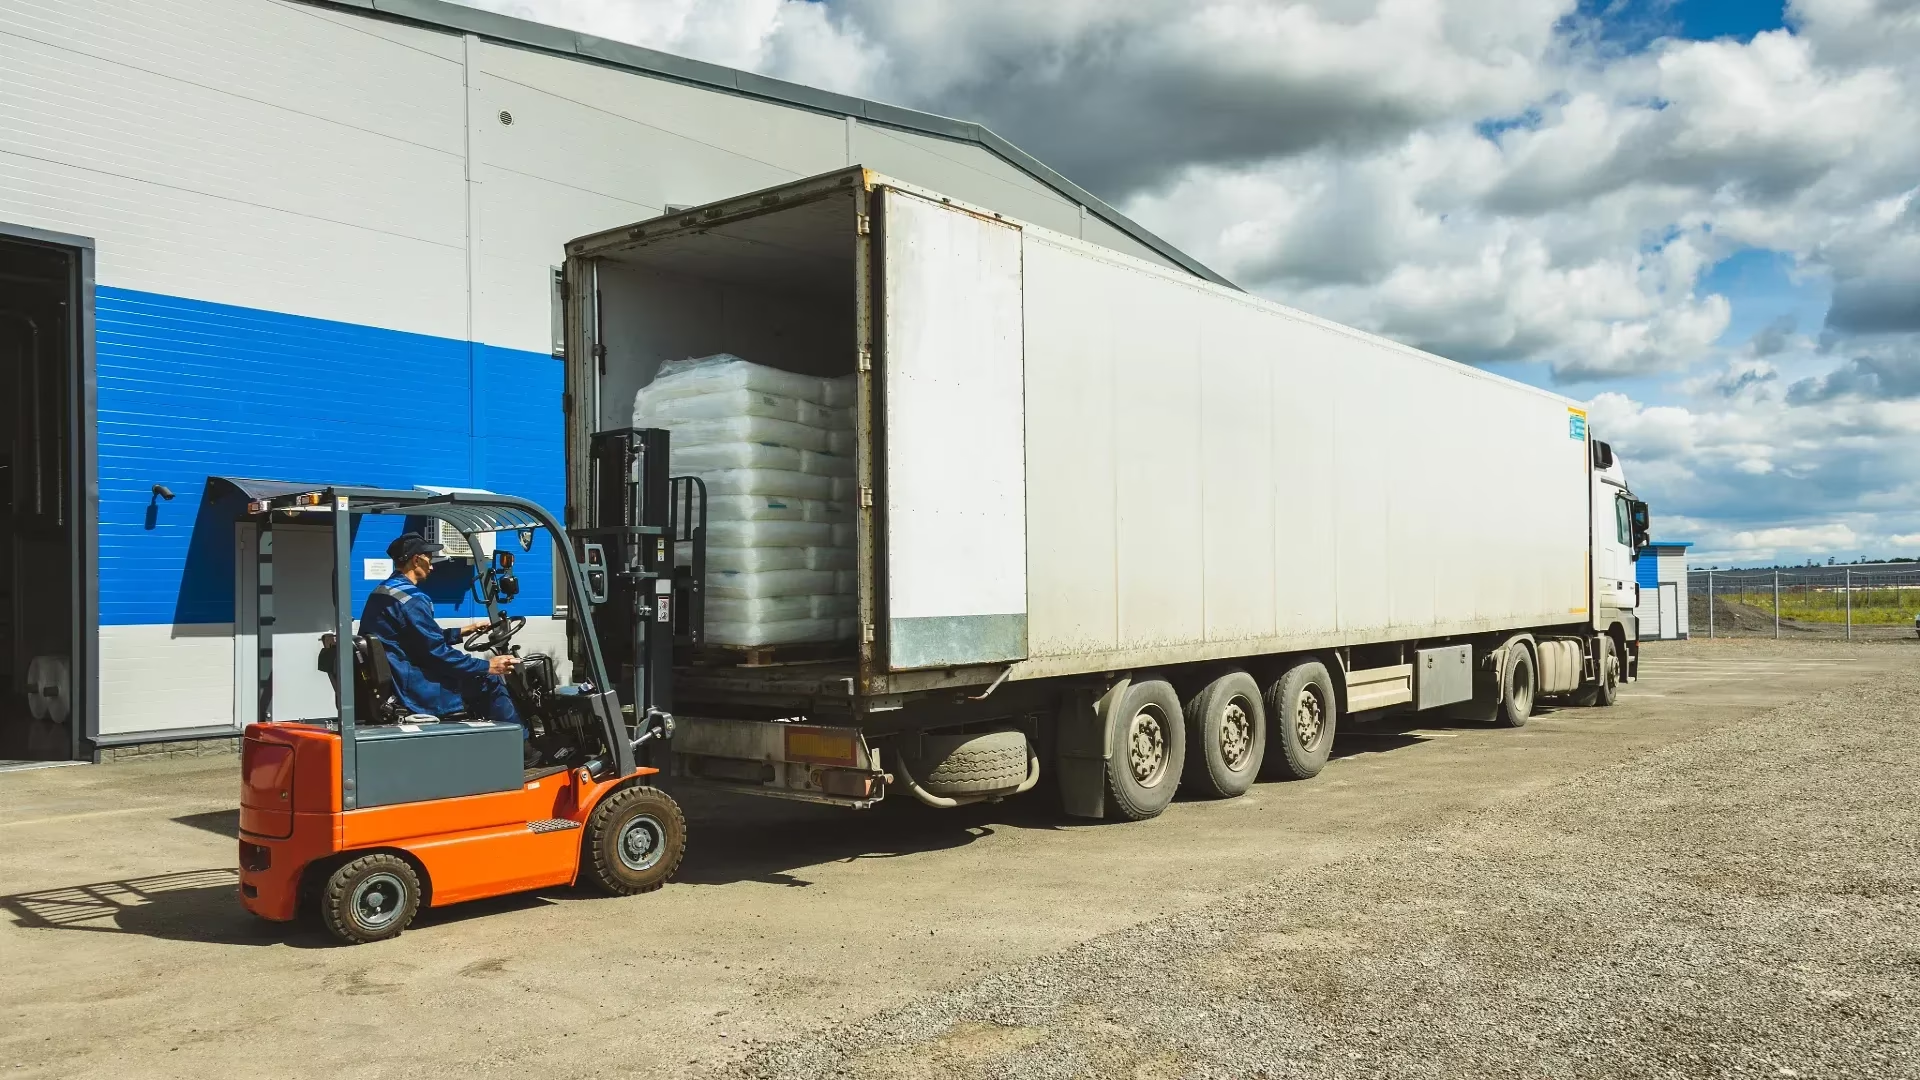
What we’ll cover
Fleets, bookings, subcontractors, compliance & payments.
With HX, you can manage them all in one place.
What a driver scorecard is and how it works
A driver scorecard is a structured performance report that tracks key driving behaviours and operational outcomes over time. It combines safety, efficiency, and compliance data into a single view that is easy for both managers and drivers to understand.
Rather than relying on isolated incidents or subjective opinions, scorecards provide a consistent evidence base. This helps operators make informed decisions and reduces the risk of bias when reviewing driver performance.
Most driver scorecards draw data from telematics systems, vehicle inspections, incident records, and policy checks. That information is then scored, weighted, and benchmarked so results can be compared fairly across drivers and operating conditions.
At its simplest, a driver scorecard answers three questions:
- How safely is the vehicle being driven?
- How efficiently is it being operated?
- How closely does the driver follow legal and company rules?
Used consistently, driver scorecards support more proactive management across haulage and logistics operations. This is especially valuable where managers cannot observe driving behaviour directly on a day-to-day basis.
Why driver scorecards matter for safety, cost and compliance
Driver behaviour sits at the centre of fleet performance. Small differences in speed control, braking, cornering, or fatigue management can affect outcomes across the business.
From a safety perspective, driver scorecards help identify patterns that often appear before incidents occur. Repeated harsh braking, speeding, or close following distances usually show up in data long before a collision or near miss is formally recorded.
From a cost perspective, smoother driving reduces fuel consumption, brake wear, tyre replacement, and unscheduled downtime. Over time, these improvements help protect margins, particularly in competitive transport markets.
Driver scorecards also help standardise expectations across complex operations. Fleets involved in intermodal transport or operating within a wider supply chain network often face varied routes, loads, and delivery pressures. Scorecards provide a consistent framework for assessing performance fairly across those differences.
Compliance is another key reason scorecards matter. They support ongoing monitoring of drivers’ hours, inspections, and policy adherence. This is particularly important for a large haulage business, where responsibility for oversight is shared across planners, managers, and depots.
The core KPIs every driver scorecard should track
Effective driver scorecards focus on a clear and manageable set of metrics. When scorecards attempt to track too many KPIs, drivers often disengage or struggle to understand what matters most.
The most reliable scorecards group driver KPI data into three core categories. This structure makes results easier to explain, compare, and act on during feedback discussions.
Safety and incident metrics
Safety KPIs focus on behaviours that increase risk on the road. These indicators are often the strongest predictors of future incidents.
Common safety metrics include:
- Speeding events relative to posted limits
- Harsh braking and rapid acceleration
- Sharp cornering or rollover risk alerts
- Following distance or tailgating alerts
- Collision, near-miss, and incident reports
Tracking trends matters more than one-off events. A single harsh brake may be unavoidable due to traffic conditions, but repeated patterns usually point to habits that need attention or support.
Over time, these metrics help fleets identify training needs, review route planning, and adjust workloads where pressure contributes to unsafe driving.
Fuel, efficiency and eco-driving metrics
Efficiency metrics show how driving style affects fuel use, emissions, and vehicle wear. These KPIs support cost control without encouraging unsafe speeds or unrealistic targets.
Typical efficiency KPIs include:
- Average fuel consumption per mile
- Idling time and engine-on idle events
- Gear use and RPM management
- Cruise control usage where applicable
In fleets operating mixed services, such as multimodal logistics, benchmarking needs to account for route type, vehicle specification, traffic conditions, and load weight. Without this context, comparisons can feel unfair and undermine trust in the scorecard.
Compliance, inspections and policy metrics
Compliance KPIs protect operator licences and reduce the risk of roadside enforcement action. They also help standardise expectations across the fleet.
Common compliance metrics include:
- Drivers’ hours infringements
- Missed or late vehicle checks
- Defect reporting accuracy
- Policy acknowledgements and training completion
- Outcomes from inspections or audits
These KPIs are particularly useful for fleets working with freight forwarders, where day-to-day visibility of driving behaviour may be limited and accountability must be clearly documented.
How to design and benchmark a fair scoring model
Fairness determines whether drivers trust a scorecard system or disengage with it. Scoring models need to reflect real operating conditions rather than ideal scenarios.
The first step is weighting. Safety-related drivers KPI measures usually carry more influence than efficiency metrics, as the consequences of unsafe behaviour are higher for drivers, the public, and the business.
The second step is benchmarking. Comparing drivers only makes sense when they operate under similar conditions. Urban delivery, regional distribution, night trunking, and long-distance motorway work each carry different risk profiles.
A simple benchmarking framework might look like this:
| KPI group | Weighting example |
| Safety metrics | 40–50% |
| Compliance metrics | 30–40% |
| Efficiency metrics | 20–30% |
Segmenting scorecards by route type, vehicle category, or operation helps drivers see the system as balanced and relevant. This approach also makes feedback conversations more constructive.

Using telematics, video and apps to power scorecards
Modern driver scorecards rely on objective data sources. Telematics systems remain central, capturing speed, braking, cornering, idling, and location data in real time.
Video telematics adds important context. Dashcam footage helps explain why events occurred and reduces disputes around scoring accuracy, particularly when drivers feel an event was unavoidable.
Mobile apps also support transparency and engagement. They allow drivers to:
- View their own scores
- Receive event alerts
- Complete vehicle checks digitally
- Access feedback or training materials
When drivers can see their own data, scorecards feel more open and consistent. This visibility often leads to better self-correction between formal reviews.
Turning scores into coaching conversations drivers trust
Data alone rarely changes behaviour. The value of driver scorecards comes from how results are discussed and acted on by managers and drivers.
Drivers respond better when feedback focuses on support rather than discipline. That requires consistent review processes, clear expectations, and respectful communication.
Feedback rhythms, training and one-to-one coaching
Short, regular check-ins are usually more effective than infrequent formal reviews. Monthly or quarterly discussions allow trends to be addressed early without creating unnecessary pressure.
Effective coaching conversations tend to:
- Start with positive behaviours
- Focus on one or two priorities
- Agree clear next steps
- Use real driving examples
Linking scorecard results to refresher training or route-specific guidance helps keep feedback practical and relevant.
Incentives, recognition and gamification that drive change
Positive reinforcement supports long-term improvement. Many fleets use recognition rather than penalties to encourage safer driving.
Examples include:
- Recognition for steady improvement
- Team-based performance targets
- Non-financial rewards such as preferred shifts
- Informal league tables within similar driver groups
These approaches work well across mixed operations involving subcontractors and directly employed drivers.
Rolling out driver scorecards across your fleet
Successful rollout depends on communication and pacing. Introducing scorecards without explanation often creates suspicion and resistance.
A phased approach works best:
- Explain why scorecards are being introduced
- Share which KPIs will be tracked and why
- Run a pilot period without formal scoring
- Gather driver feedback before finalising benchmarks
For operators starting a haulage company, early adoption of driver scorecards helps establish clear expectations before habits are formed.
Proving impact and avoiding common mistakes
Measuring success means looking beyond individual scores. Fleet-wide trends often provide clearer evidence of impact over time.
Useful indicators include:
- Fewer incidents and near misses
- Changes in fuel spend per mile
- Reduced inspection failures
- Lower downtime linked to driving behaviour
Common mistakes include inconsistent scoring, frequent KPI changes, and poor communication. Any perception of unfairness can quickly undermine trust and engagement.
What’s next: AI-driven and predictive driver scorecards
Driver scorecards are moving beyond historical reporting. AI-driven tools now analyse patterns across behaviour, routes, traffic, and conditions to predict risk.
Predictive models allow earlier intervention and more targeted coaching. Over time, scorecards are likely to become more personalised, focusing on individual risk profiles rather than uniform benchmarks.
Frequently asked questions
What KPIs should be included on a driver scorecard?
A driver scorecard should include safety, efficiency, and compliance KPIs. Common examples include speeding events, harsh braking, fuel use, drivers’ hours compliance, and vehicle check completion.
How is a driver score calculated?
A driver score is calculated by weighting different KPIs and combining them into a single score or rating band. Safety and compliance metrics usually carry more weight than efficiency measures.
How do you benchmark driver performance fairly?
Fair benchmarking groups drivers by similar routes, vehicles, and work types. Comparing like-for-like operations helps account for differences in traffic, load, and environment.
How often should driver scorecards be reviewed?
Most fleets review driver scorecards monthly or quarterly. Regular reviews help identify trends without creating unnecessary pressure from constant monitoring.
Will drivers see driver scorecards as a punishment?
Drivers are less likely to resist scorecards when the purpose is explained clearly. When used for coaching and recognition rather than discipline, scorecards tend to gain acceptance.
What role do telematics and dashcams play in driver scoring?
Telematics provides objective data on driving behaviour, while dashcams add visual context to events. Together, they create a more accurate and balanced driver KPI picture.
What are the most common mistakes when implementing driver scorecards?
Common mistakes include unclear benchmarks, inconsistent scoring, and poor communication. Rolling out scorecards without driver input often leads to mistrust.
Can small fleets benefit from driver scorecards?
Yes. Small fleets often see quicker results because communication is simpler and feedback can be more personal, making behaviour changes easier to sustain.